Despite no signs of deceleration in US growth and geopolitical risk, the US Dollar has rallied 6% off its year-to-date seasonal low. While the European Central Bank (ECB) is considering rate cuts in June, Great Britain is in a recession, and the US continues to have a sticky inflation rate, so dollar bulls remain vigilant, resulting in a sentiment shift from the beginning of the year .
But what’s left in this dollar rally?
The Federal Open Market Committee (FOMC) is still concerned about inflation, which is running at 3.5% compared to a target rate of 2%. This week, the market will receive two key economic reports: the GDP Growth Rate, the Core PCE Price Index, and personal income and spending.
The last quarter of 2023 saw GDP at 3.4%. Estimates are coming in for 2.3%—2.5% for the first quarter 2024. If these estimates are correct and the economy contracts, the dollar could come under some selling pressure. The US employment situation has been intense, and consumer confidence and spending could lend to a higher GDP print.
The inflation report of interest to the FOMC will be the PCE Price Index. Previously, the Core PCE was .3%. Estimates for March are for .3%. Despite this report being Core PCE, excluding food and energy, other sectors have shown price increases as reported in previous CPI and PPI reports. In January, Core PCE shocked the markets with a .5% print. Inflation to date has not shown signs of wavering.
Personal income and spending will also be closely watched. Last month’s numbers showed a .8% increase in consumer spending, while income only increased by .3%. Estimates for income are .4% to .5%. Meanwhile, estimates for spending are .5% to .6%. A better employment situation made consumers more confident about their financial future, and the warmer weather could lead to another spike in personal spending.
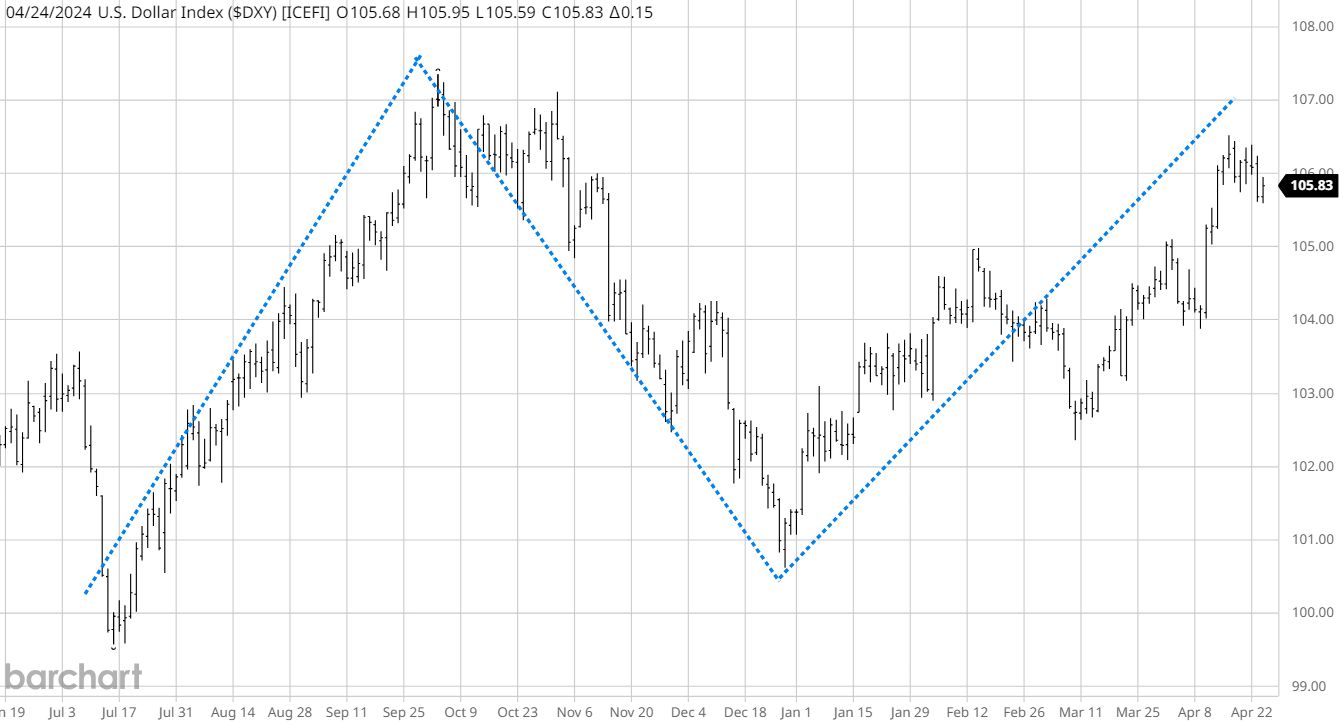
Technicals
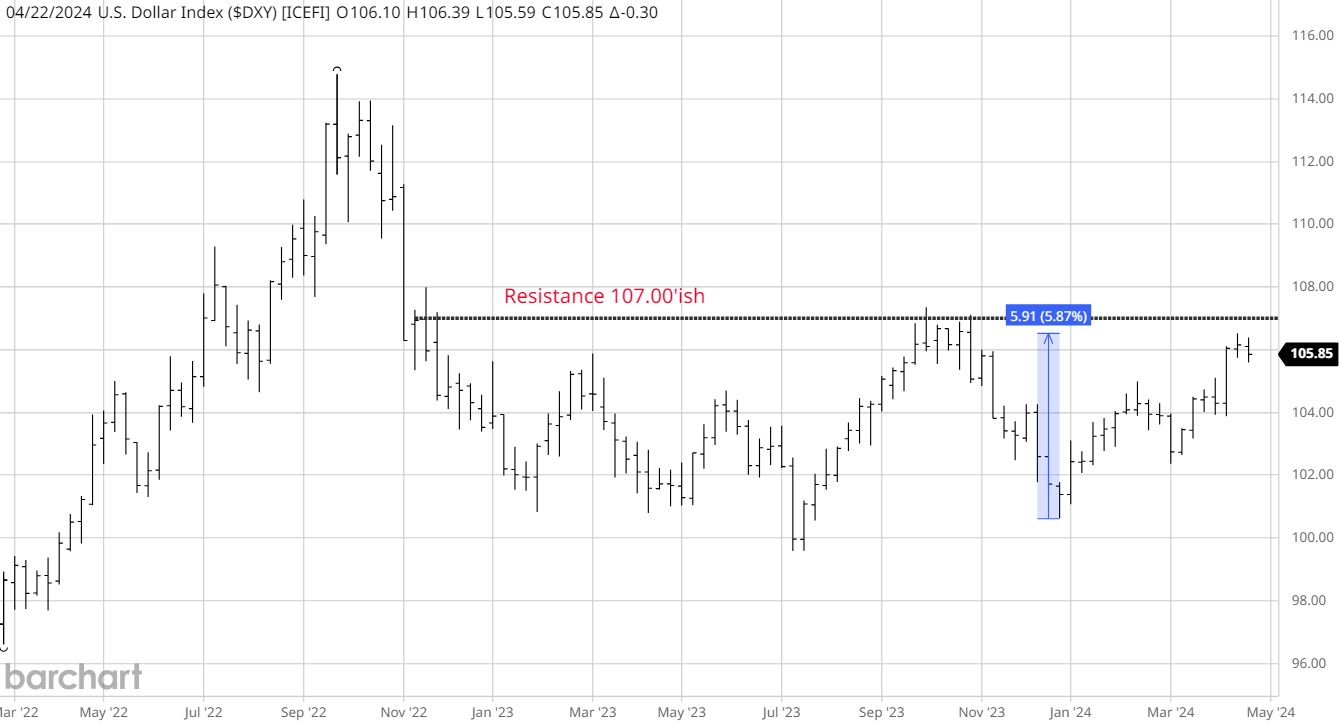
Source: Barchart
The weekly US Dollar (DXY) chart shows the 6% seasonal rally off the January lows. During this move, the market made weekly higher lows and higher highs, confirming the current uptrend.
Overhead, there is some significant resistance at the 107.00′ ish area. The momentum is still up, and until the trend changes, I would favor higher prices for the US dollar from current levels. Trading under the 102.00′ ish level would negate the current trend.
US Interest Rates
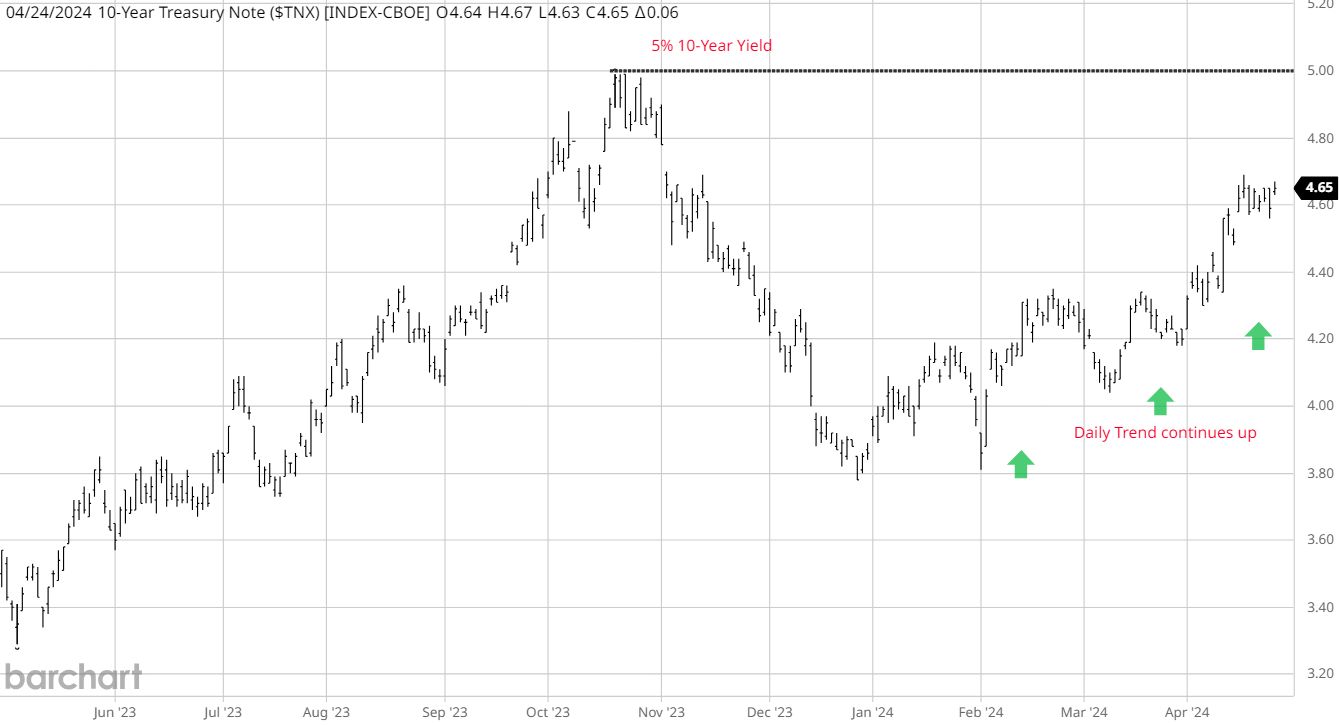
The 10-year Treasury yield has been steadily climbing since FED Chairman Powell spiked the punch bowl in December with the idea that they might cut rates 4-5 times in 2024.
Source: Barchart
The US Dollar is a haven for interest rate differential traders as the long end of the yield curve has risen more than any of the other G-7 countries. The market appears to have priced in most of the bullish news for the dollar, but the upcoming economic reports we discussed could add more fuel to this uptrend.
Stock Market Correction
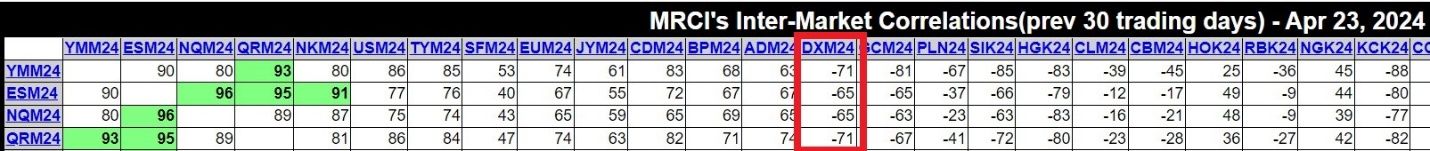
The S&P 500 has corrected about 5% from its all-time high. The US Dollar and Stock indices have been inversely correlated for 30 days (see table below). If the stock market correction continues due to the exuberance of bullishness from the FOMC comments in December for lower rates, plenty of longs in the market will be washed out, leading to more dollar strength.
Source: Moore Research Center, Inc. (MRCI)
Traders of Financial Futures (TFF) Report
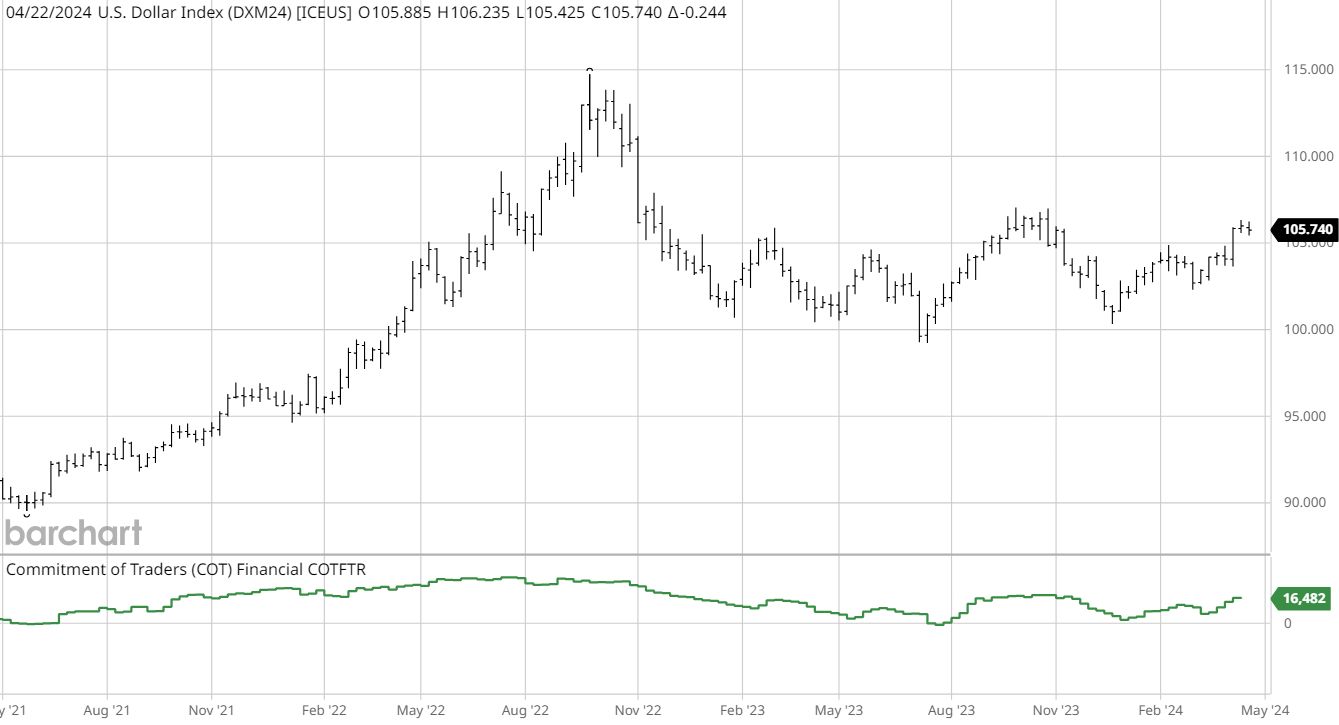
Source: Barchart
Looking at the weekly DXY chart, the asset managers (green line) positions have tracked the DXY well for the past three years. During this time, they have remained net long. Currently, they have been buying since the January lows. They recently increased their longs as the market made a new swing high with a bullish posture.
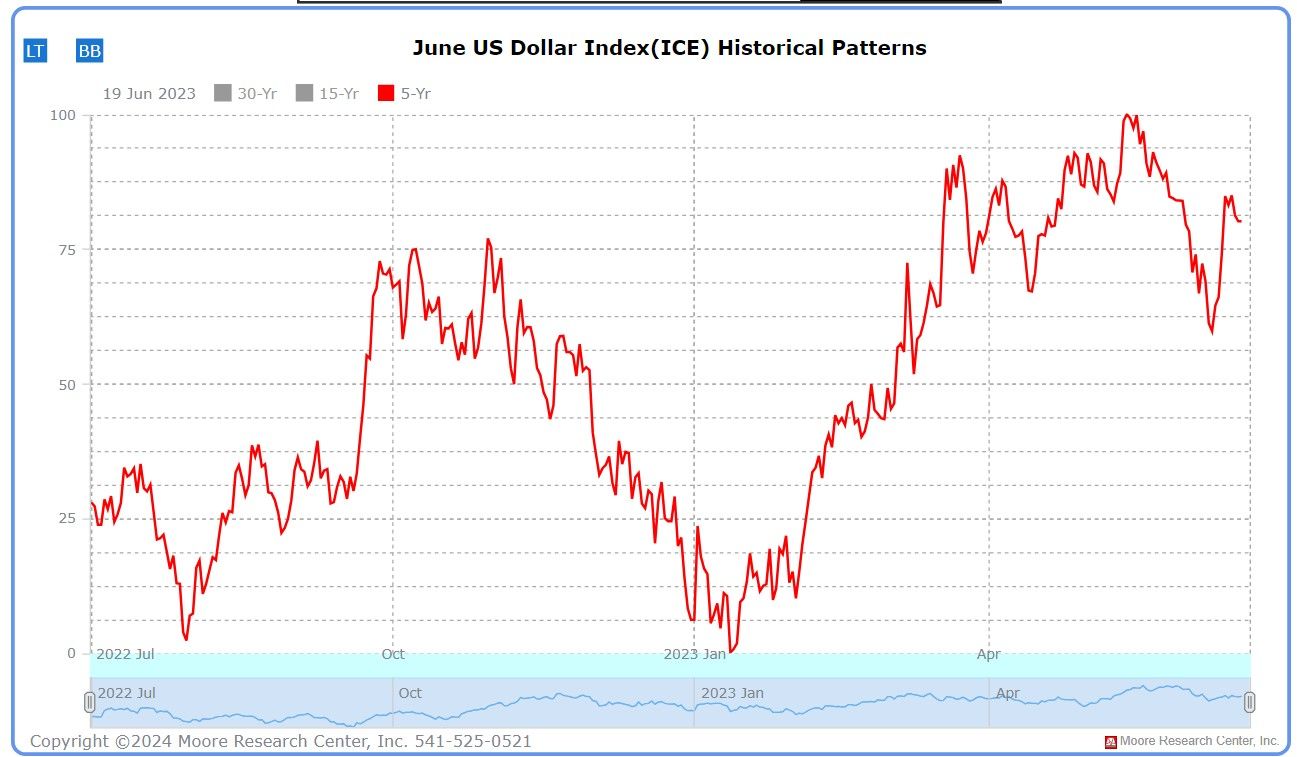
Seasonal Pattern
Source: MRCI
Source: Barchart
MRCI research shows the US dollar’s 5-year seasonal pattern (red line). Considering economies’ economic changes post-COVID, the dollar’s 5-year pattern has been tracking extremely well since June 2023 (blue line).
Reasons I see more strength in the US Dollar:
- The current uptrend still has some time to expand. The dollar usually changes trend near the end of May.
- Interest rates are still climbing-approaching 5%, which is bullish for the dollar.
- Upcoming economic reports may surprise and show the economy is still inflationary.
- Asset traders on the TFF report reflect continued buying during the latter part of this dollar rally.
- Geopolitical events and US growth are not going away anytime soon.
- The stock market continues its exuberance correction, moving inversely to the US Dollar.
More Stock Market News from Barchart
On the date of publication, Don Dawson did not have (either directly or indirectly) positions in any of the securities mentioned in this article. All information and data in this article is solely for informational purposes. For more information please view the Barchart Disclosure Policy here.
The views and opinions expressed herein are the views and opinions of the author and do not necessarily reflect those of Nasdaq, Inc.


